


Debug Instrumentation via Flash ActionScript
Browser plug-ins have always been an attractive target for attackers to exploit. In the last couple of years, the most prevalent attack platform was undoubtedly – Flash. With 250+ CVEs in 2016 alone, and incorporation in practically every exploit kit, Flash exploits are everywhere and deserve our attention.
As researchers, we stumble upon many cases where we are required to analyze exploits found in the wild and collect as much information as possible regarding the exploit`s internal workings. This process quite often proves to be tedious and very time consuming, making the research task far from optimal. As most of an exploit’s juicy parts (such as ROP chains, Shellcodes and payload) are generated at runtime, we decided to take a different approach and make this process much more informative by utilizing the existing abilities found in native level debuggers.
Using this approach, we were able to gain a much wider view into the inner working of Flash-based exploits, making the research process much quicker and easier to manage.
This report explains the details of our approach and its advantages as well as showing some popular use cases in which it can be applied. But before diving in to Flash exploration techniques, let’s quickly go over the SWF basics.
Flash Basics
SWF 101
The SWF format was designed to deliver vector graphics (and apparently exploits) over the Internet. Built with network delivery in mind, it is a binary format that uses compression, bit-packing, and structures with optional fields to minimize its file size.
Basically, a SWF file is composed of a series of tagged data blocks. Tags can define shapes to be displayed or audio streams to be played, but most importantly regarding exploitation, it can deliver ActionScript 3.0 bytecode.
DoABC
This tag contains an ActionScript Bytecode (ABC) block that is parsed by the ActionScript 3.0 virtual machine.
It also includes the constant pool of static values, classes, and methods used by the Flash file.
For example, the following code:
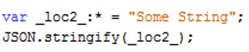
Will compile to this bytecode:
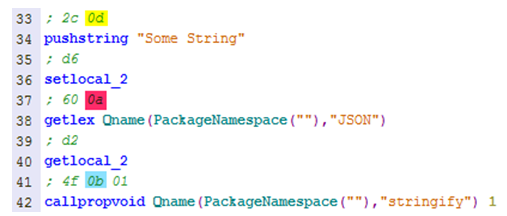
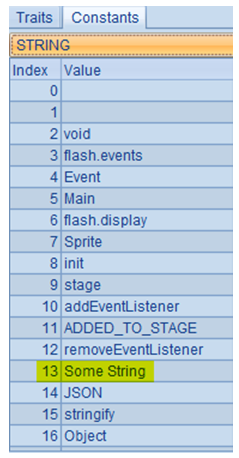
As you can see, the pushstring instruction refers to string number 13 (0d) in the constant pool:
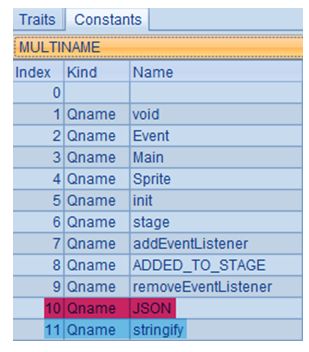
While getlex and callpropvoid refer to qualified names (QNAMEs) in the constant pool:
Analysis Methods
When analyzing Flash exploits, there are a few methodologies commonly in use today.
Source Code decompile and edit
The easiest approach is to use de-compilers such as FFDEC to acquire the actual source code and edit it.
As tempting as an exploit source code might sound, things are not that simple. Attackers use sophisticated obfuscation and packing techniques which result in a very hard to read pseudo-code. Moreover, exploit writers often add junk code and unreachable labels as a way to break de-compilers.
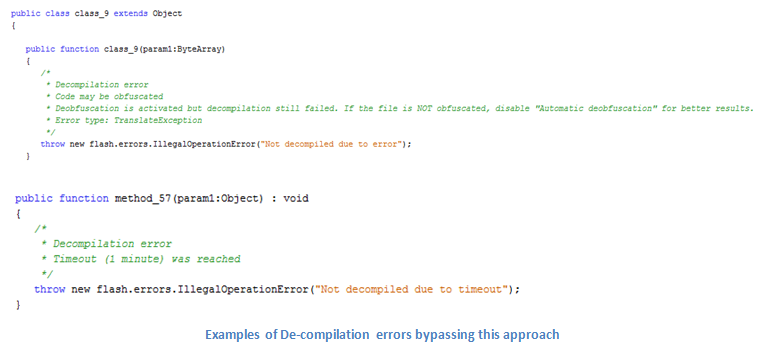
Additionally, even in cases when de-compilation returns valid code, there still is a chance that the byte code was misinterpreted, which results in an incorrect code and a lot of confusion.
Disassemble and trace
A different approach is to disassemble the SWF file. Disassemblers such as RABCdasm enable us to dump the bytecode of ABC tags out of a SWF file (instead of decompiling it), modify and re-assemble it.
Changing the bytecode allows us to inject some debug functions such as trace at critical points, as presented by Matt Oh. No doubt, this is a powerful method. However, hooking the disassembled code with trace functions limits us to the scope and capabilities of the Flash player debugger.
Our approach – Disassemble and Debug Instrument
As opposed to Flash player debugging, sometimes it can prove much more useful to have some native level debugging capabilities. This is extremely relevant when working with JIT level functions or performing root-cause analysis.
When analyzing Internet Explorer exploits, a common technique is to insert some non-popular functions such as Math::Atan2() with a debug string as an argument, while watching it from WinDBG where we have a better view of the memory and code layout. (http://d0cs4vage.blogspot.co.il/2013/06/windbg-tricks-javascript-windbg.html)
We decided to adapt this technique to Flash ActionScript. This approach allows us to get a better understanding of the heap during the exploitation, which would be impossible with the Flash player debugger. By injecting some non-popular functions (in this example, JSON.stringify), we would be able to beat strings obfuscation and see byte arrays as they are dynamically created and allocated.
We add the non-popular function to the SWF file through its disassembled bytecode, thus bypassing any anti-decompilation techniques the exploit writer might have used.
This investigation process has two parts:
- Setting the necessary breakpoint in WinDBG.
- Hooking the original SWF with our instrumented function.
As Adobe does not provide debug symbols, this requires some reverse engineering.
Setting the necessary breakpoint in WinDBG – aka finding a debug function
Our only requirement is that the instrumented function would handle strings, and hopefully is never called by the exploit itself. Therefore, we chose to instrument the JSON.stringify function.
Finding its offset in the Flash library is relatively easy. We allocate a string object, search for it in memory with WinDbg, set a breakpoint on access to the string, and then trigger JSON.stringify on the string, as follows:
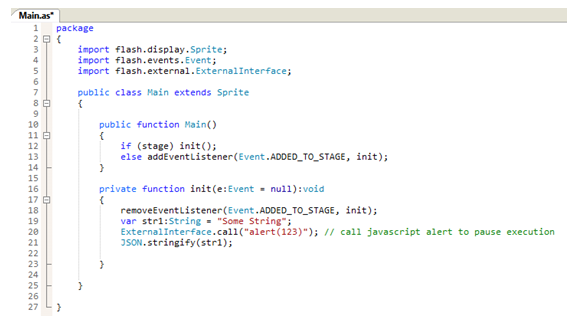
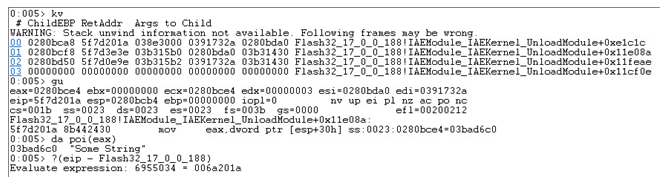
After building the ActionScript project, we embed the created SWF in a local html file and open it in IE. We can attach WinDbg to the IE process and break at the alert() we created, using ExternalInterface.call().
When the alert is popped, the Flash pauses. At this point, we use Mona.py to find the allocated string object and set the debugger to break on access to it.
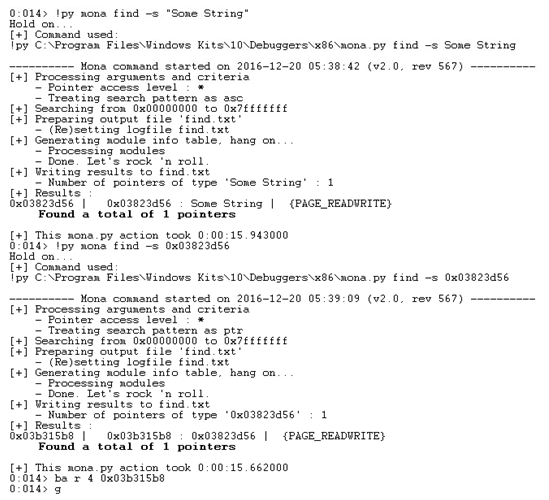
And sure enough, when we resume the Flash after the alert, we hit our breakpoint.
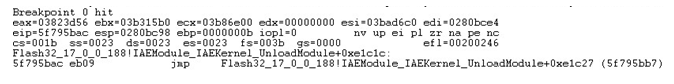
Now we need to verify that this operation is indeed related to JSON.stringify(). Inspecting this address in IDA reveals exactly that:
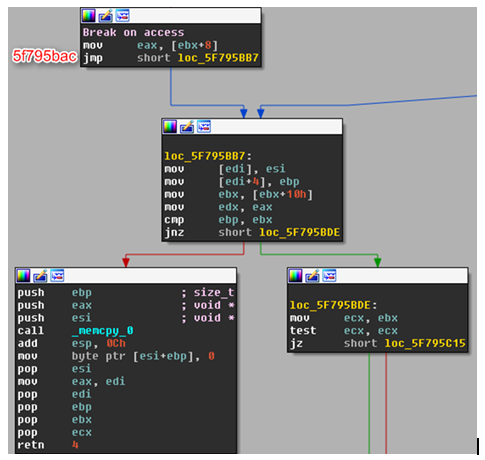
With the functionality of JSON.stringify() in mind, _memcpy_0 definitely looks promising. If all goes according to plan, on function return – eax should hold a pointer to the stringified object.
Success! Putting it all together, we can create a breakpoint that prints all the strings that are being sent to json.stringify(), in our windbg console.
bp (Flash32_17_0_0_188 + 006a201a) “.echo ——-; da poi(eax)”
Hooking the original SWF with our instrumented function – our class
Obviously, printing plain strings is not enough when handling various objects and data types. However, we can append our own class to the flash file, which enables us to perform more complicated logic and handle every data type. The class is called “exploit_common” and the main function we use is debugPrint().
You can get the class from our Github in this link: https://github.com/CheckPointSW/flash_instrumentation/blob/master/exploit_common.as
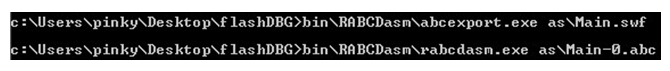
It receives any object as an argument and treats it according to its type, thus simplifying the hooking process. However, we cannot simply add ActionScript code to the exploit as plain text. So we grab a copy of the Flex SDK provided by adobe and compile the library using the following command
![]()
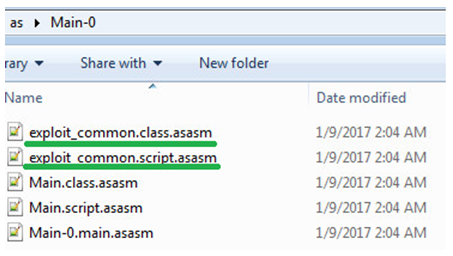
Where “as” is the path to your ActionScript library. Next, we disassemble the newly created SWF using RABCDasm.
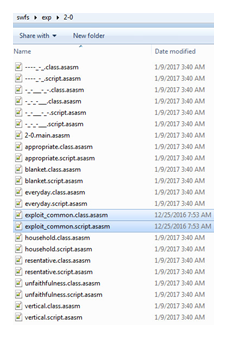
We then copy the library’s .asasm files and save them on the side, as we will need them later on.
Use Cases
Let’s have some fun with real exploits.
Sundown is one of the most active recent exploit kits. Let’s take a copy of its latest Flash exploit from the PCAP file provided at Malware-traffic-analysis.
Again, we start by dumping the DoABC tags out of the malicious SWF and disassemble its classes.
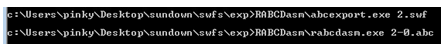
Note that abcexport will dump the DoABC tags with an appended index; we are disassembling the first one (it is zero based).
Each tag disassembly results in a few .class.asasm and .script.asasm files, and a single main.asasm.
Main.asasm must be edited to include our library.
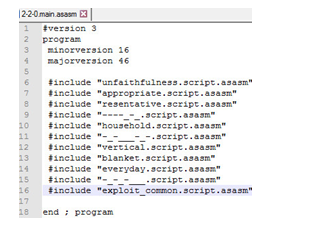
Of course, we need to add the .asasm files of the library we compiled earlier.
From that point on, we have the ability to call our own functions within the exploit. Cool! Looking at an obfuscated flash exploit can be quite frustrating. In Sundown’s case, it seems like some of the classes’ names were randomly generated.
Dumping the Shellcode
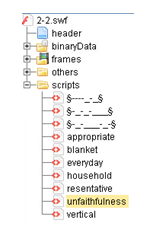
The SWF main class is called “unfaithfulness.”
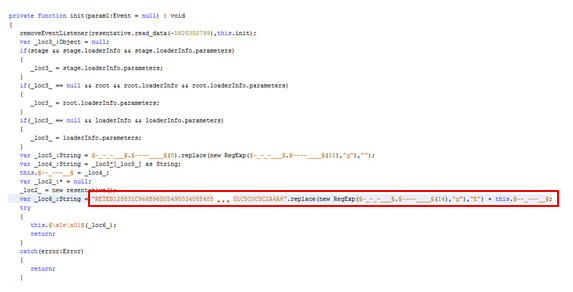
Deep inside the Main class init function, we see a very long obfuscated string. It might be interesting to see what its purpose is. Let’s hook it!
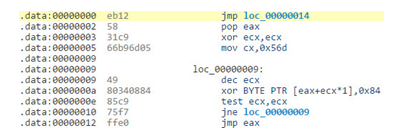
The single line of code highlighted above actually looks like this in ABC instructions:
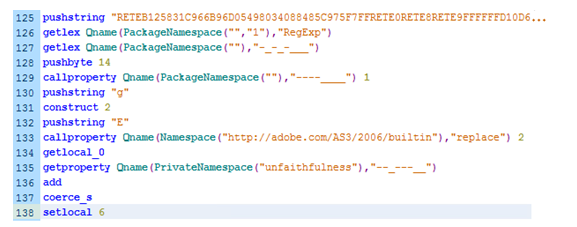
Figure 1 – The Generated ByteCode
In Bytecode, assignment of locals is done with the setlocal_n instruction while the value is popped off the AVM stack. Therefore, hooking should be done after the assignment of _loc6_ and should look somewhat like this:
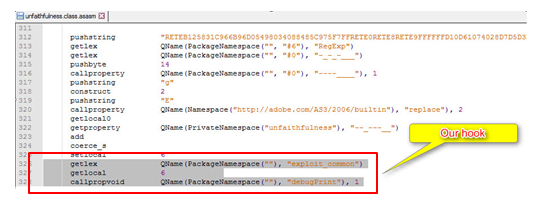
It’s time to save the .asasm file, assemble it to an .abc file, and replace the DoABC tag of the exploit with our hooked tag.

The abcreplace.exe tool takes three arguments:
- .SWF file to modify
- Index of the tag that should be replaced
- Our modified tag
Embed the hooked SWF in a HTML file and fire up your favorite debugger.
After setting up our instrumented breakpoint and running the exploit – we can see a hit.
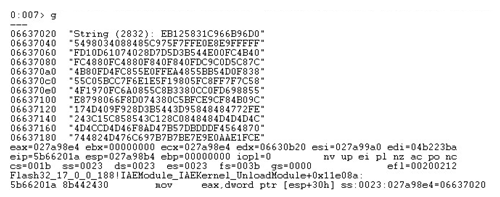
_loc6_ was printed out and it definitely looks like a shellcode, starting with the traditional XOR loop.
Dumping the decoded Shellcode might be cool, but the real strength of this method is the ability to understand the heap layout. So let’s do it.
Examining the heap spray
This is one of the first functions called in the exploit:
Two vectors are created at spray_obj()
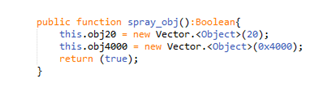
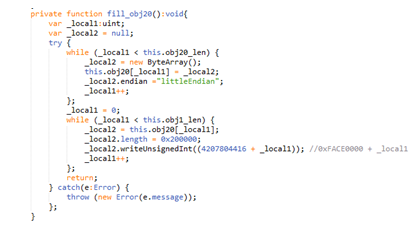
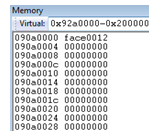
The Vector obj20 holds 20 byte arrays of length 0x200000. Each of these arrays starts with an incremented signature with the base of 0xFACE0000.
The Vector 0bj4000 holds 0x4000 instances of “everyday” class:
What is the “everyday” class, you might ask.
This object definitely looks like a sprayable object that starts with some unique signatures.
After all heap operations and manipulations are set, it’s time to trigger the vulnerability. An out-of-bounds read by 78 bytes is performed. As you recall, the bytearrays in obj20 are only 0x200000 bytes long. On successful spray, the leaked object, right after obj20 last member, should be of “everyday” type. Here is the actual verification in the code.
This is the critical point we want to hook with some informative description and the value of _local7.
This should provide us with some valueable information regarding the heap layout.
Again, save, assemble, and replace our modified tag:
![]()
Setting the necessary breakpoint in WinDbg results in these hits:
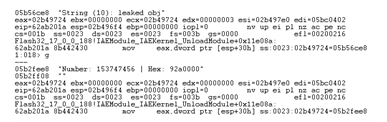
We can see that on 0x78 offset, we have our first “everyday” member 0xffeedd00:
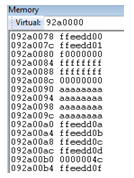
As we know obj20 byte arrays are 0x200000 long, we expect to find it at 0x090a0000:
This is only an example of how powerful this method is. From that point, we are able to set further breakpoints on access to the leaked object, search the memory for patterns and signatures incorporated in the exploit, and understand the alignment of their allocations, to name just a few capabilities.
Conclusion
From exploit kits to targeted attacks, Flash exploits are everywhere. They are heavily obfuscated, in an attempt to avoid static signatures and make life difficult for researchers. It is possible to use the trace function and run exploits with a Flash Debug Player and avoid native level debugging. However, while native level debugging is challenging, when it comes to applications with underlying virtual machines such as Flash, it is very powerful and has several advantages. Instrumenting non-popular functions as an informative break-point, we are able to halt the exploit’s flow at critical points, print valuable data, and debug the malicious SWF with a broader perspective than that of a traditional debug player.
You may also like

Shifting Attack Landscapes and Sectors in Q1 2024 with a 28% increase in cyber attacks globally

Not So Private After All: How Dating Apps Can Reveal Your Exact Location

Agent Tesla Targeting United States & Australia: Revealing the Attackers’ Identities